Chương 2: Xây dựng bảng điều khiển
Phần đầu tiên của hướng dẫn này đã giới thiệu cho bạn hầu hết các ý tưởng về Owl. Bây giờ là lúc tìm hiểu toàn bộ về khung JavaScript của SoOn, được ứng dụng khách web sử dụng.

Để bắt đầu, bạn cần có máy chủ SoOn đang chạy và thiết lập môi trường phát triển. Trước khi bắt đầu bài tập, hãy đảm bảo bạn đã làm theo tất cả các bước được mô tả trong tutorial giới thiệu. Đối với chương này, chúng ta sẽ bắt đầu từ bảng điều khiển trống do tiện ích bổ sung awesome_dashboard cung cấp. Chúng tôi sẽ dần dần thêm các tính năng vào nó bằng cách sử dụng khung JavaScript SoOn.
Mục tiêu
Giải pháp cho từng bài tập của chương được lưu trữ trên kho lưu trữ hướng dẫn chính thức của SoOn.
1. Bố cục mới
Hầu hết các màn hình trong ứng dụng khách web SoOn đều sử dụng bố cục chung: bảng điều khiển ở trên cùng, với một số nút và vùng nội dung chính ngay bên dưới. Việc này được thực hiện bằng cách sử dụng Thành phần bố cục, có sẵn trong @web/search/ bố cục.
Cập nhật thành phần
AwesomeDashboardnằm trongawesome_dashboard/static/src/để sử dụng thành phầnLayout. Bạn có thể sử dụng{controlPanel: {} }cho propsdisplaycủa thành phầnLayout.Thêm prop
classNamevàoLayout:className="'o_dashboard h-100'"Thêm tệp
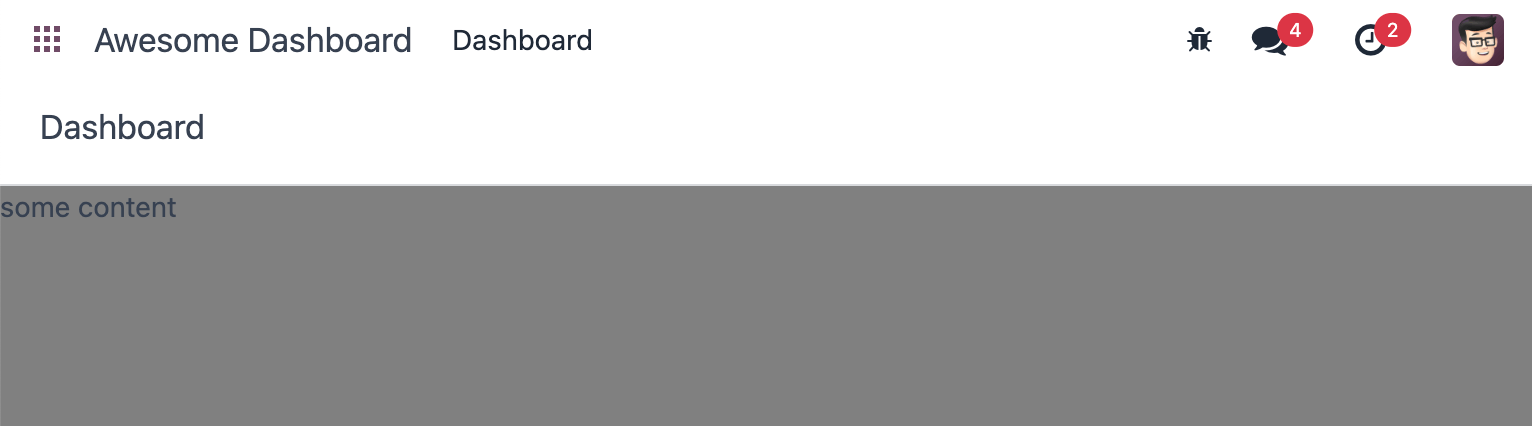
dashboard.scsstrong đó bạn đặt màu nền của.o_dashboardthành màu xám (hoặc màu bạn yêu thích)
Mở http://localhost:8069/web, sau đó mở ứng dụng Awesome Dashboard và xem kết quả.
Lý thuyết: Dịch vụ
In practice, every component (except the root component) may be destroyed at any time and replaced (or not) with another component. This means that each component internal state is not persistent. This is fine in many cases, but there certainly are situations where we want to keep some data around. For example, all Discuss messages should not be reloaded every time we display a channel.
Also, it may happen that we need to write some code that is not a component. Maybe something that process all barcodes, or that manages the user configuration (context, etc.).
Khung công tác SoOn xác định ý tưởng về service, là một đoạn mã cố định xuất trạng thái và/hoặc hàm. Mỗi dịch vụ có thể phụ thuộc vào các dịch vụ khác và các thành phần có thể nhập một dịch vụ.
Ví dụ sau đăng ký một dịch vụ đơn giản hiển thị thông báo cứ sau 5 giây:
import { registry } from "@web/core/registry";

const myService = {
    dependencies: ["notification"],
    start(env, { notification }) {
        let counter = 1;
        setInterval(() => {
            notification.add(`Tick Tock ${counter++}`);
        }, 5000);
    },
};

registry.category("services").add("myService", myService);
Dịch vụ có thể được truy cập bởi bất kỳ thành phần nào. Hãy tưởng tượng rằng chúng ta có một dịch vụ để duy trì một số trạng thái chia sẻ:
import { registry } from "@web/core/registry";

const sharedStateService = {
    start(env) {
        let state = {};
        return {
            getValue(key) {
                return state[key];
            },
            setValue(key, value) {
                state[key] = value;
            },
        };
    },
};

registry.category("services").add("shared_state", sharedStateService);
Sau đó, bất kỳ thành phần nào cũng có thể thực hiện việc này:
import { useService } from "@web/core/utils/hooks";

setup() {
   this.sharedState = useService("shared_state");
   const value = this.sharedState.getValue("somekey");
   // do something with value
}
2. Thêm một số nút để điều hướng nhanh
Một dịch vụ quan trọng do SoOn cung cấp là dịch vụ hành động: nó có thể thực hiện tất cả các loại hành động tiêu chuẩn do SoOn xác định. Ví dụ: đây là cách một thành phần có thể thực thi một hành động bằng id xml của nó:
import { useService } from "@web/core/utils/hooks";
...
setup() {
      this.action = useService("action");
}
openSettings() {
      this.action.doAction("base_setup.action_general_configuration");
}
...
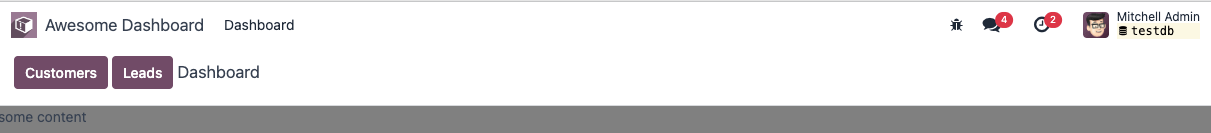
Bây giờ chúng ta thêm hai nút vào bảng điều khiển của mình:
Nút
Khách hàng, mở chế độ xem kanban với tất cả khách hàng (hành động này đã tồn tại, vì vậy bạn nên sử dụng id xml của nó).A button
Leads, which opens a dynamic action on thecrm.leadmodel with a list and a form view. Follow the example of this use of the action service.
Xem thêm
3. Add a dashboard item
Bây giờ chúng ta hãy cải thiện nội dung của chúng tôi.
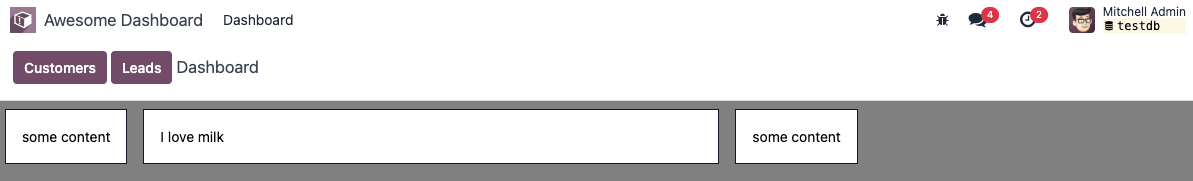
Create a generic
DashboardItemcomponent that display its default slot in a nice card layout. It should take an optionalsizenumber props, that default to1. The width should be hardcoded to(18*size)rem.Add two cards to the dashboard. One with no size, and the other with a size of 2.
Xem thêm
4. Gọi đến máy chủ, thêm một số thống kê
Let's improve the dashboard by adding a few dashboard items to display real business data.
The awesome_dashboard addon provides a /awesome_dashboard/statistics route that is meant
to return some interesting information.
Để gọi một bộ điều khiển cụ thể, chúng ta cần sử dụng rpc service. Nó chỉ xuất một hàm duy nhất thực hiện yêu cầu: rpc(route, params, settings). Một yêu cầu cơ bản có thể trông như thế này:
setup() {
      this.rpc = useService("rpc");
      onWillStart(async () => {
         const result = await this.rpc("/my/controller", {a: 1, b: 2});
         // ...
      });
}
Cập nhật
Dashboardđể nó sử dụng dịch vụrpc.Gọi lộ trình thống kê
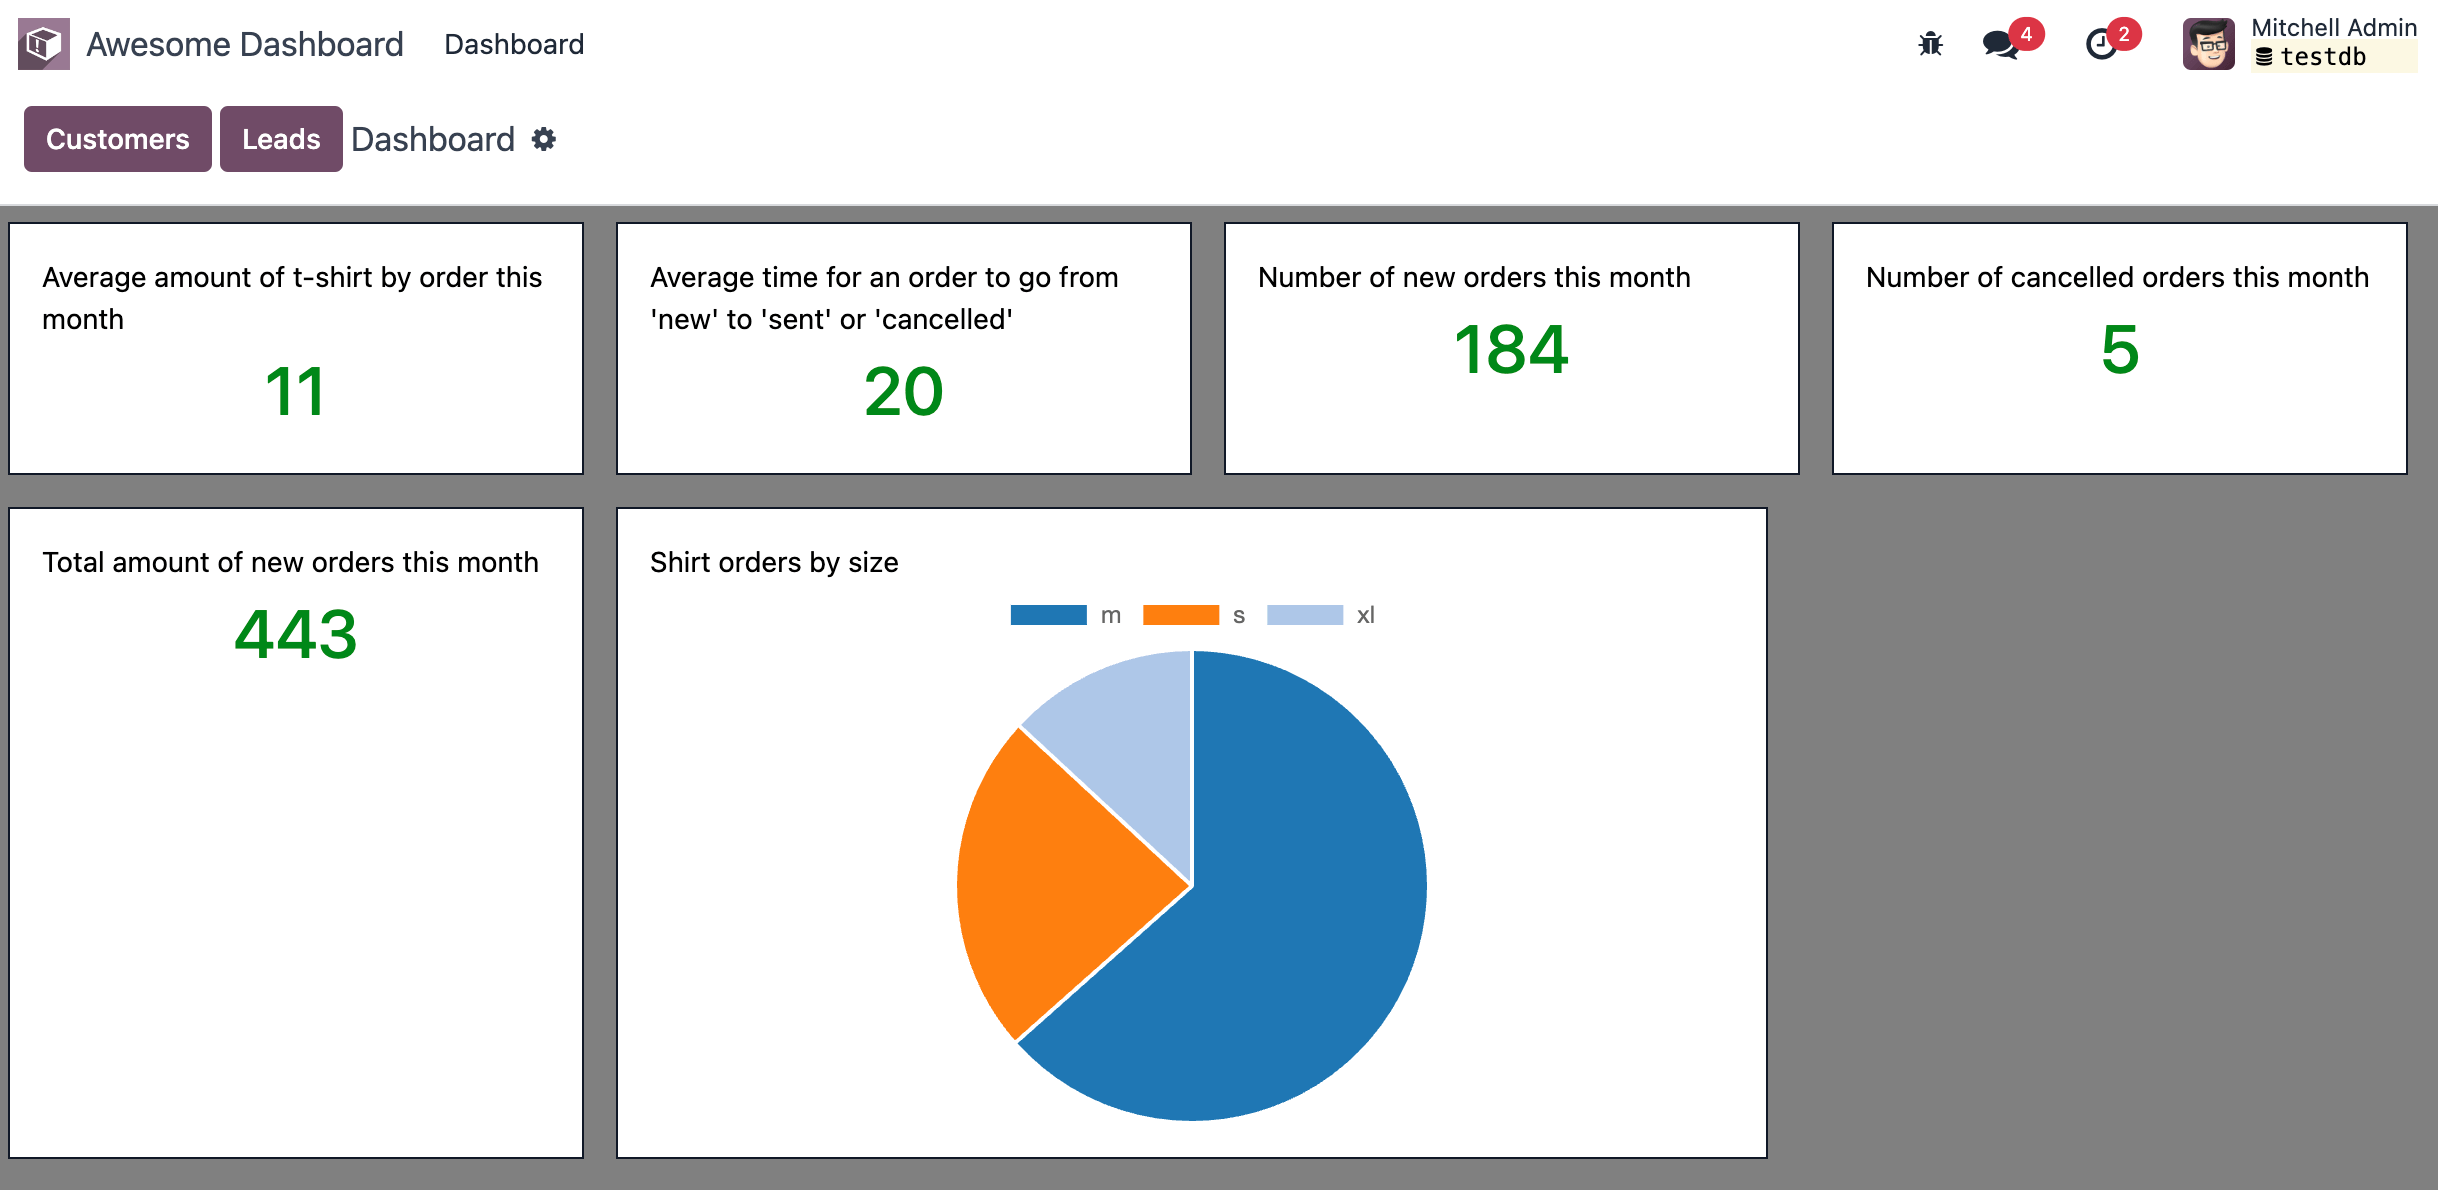
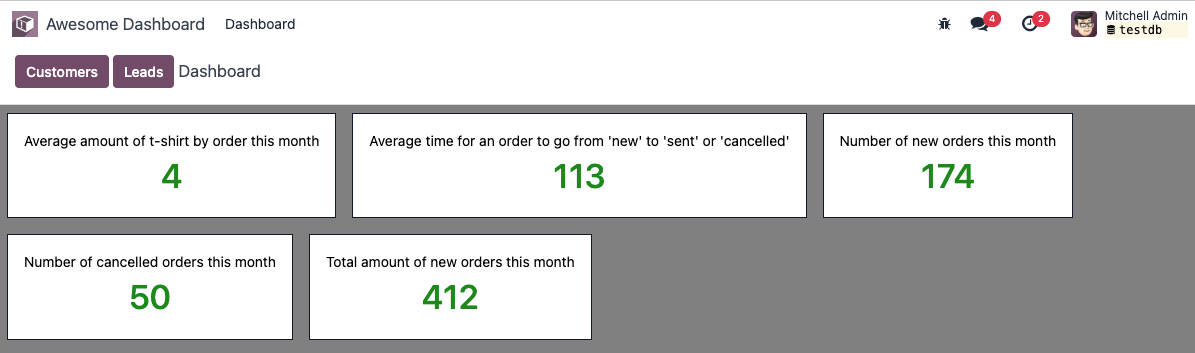
/awesome_dashboard/statisticstrong hookonWillStart.Hiển thị một số thẻ trong trang tổng quan có chứa:
Số lượng đơn đặt hàng mới trong tháng này
Tổng số lượng đơn đặt hàng mới trong tháng này
Số lượng áo thun trung bình theo đơn đặt hàng trong tháng này
Số đơn hàng bị hủy trong tháng này
Thời gian trung bình để một đơn hàng chuyển từ 'mới' sang 'đã gửi' hoặc 'bị hủy'
Xem thêm
5. Cache cuộc gọi mạng, tạo dịch vụ
Nếu bạn mở tab Network của công cụ phát triển trên trình duyệt, bạn sẽ thấy lệnh gọi tới /awesome_dashboard/statistics được thực hiện mỗi khi hành động của máy khách được hiển thị. Điều này là do hook onWillStart được gọi mỗi khi thành phần Dashboard được gắn kết. Nhưng trong trường hợp này, chúng tôi chỉ muốn thực hiện điều đó lần đầu tiên, vì vậy chúng tôi thực sự cần duy trì một số trạng thái bên ngoài thành phần Dashboard. Đây là một trường hợp sử dụng tốt cho một dịch vụ!
Đăng ký và nhập dịch vụ
awesome_dashboard.statisticsmới.Nó phải cung cấp một hàm
loadStatisticsmà khi được gọi sẽ thực hiện rpc thực tế và luôn trả về cùng một thông tin.Use the memoize utility function from
@web/core/utils/functionsthat allows caching the statistics.Sử dụng dịch vụ này trong thành phần
Dashboard.Check that it works as expected.
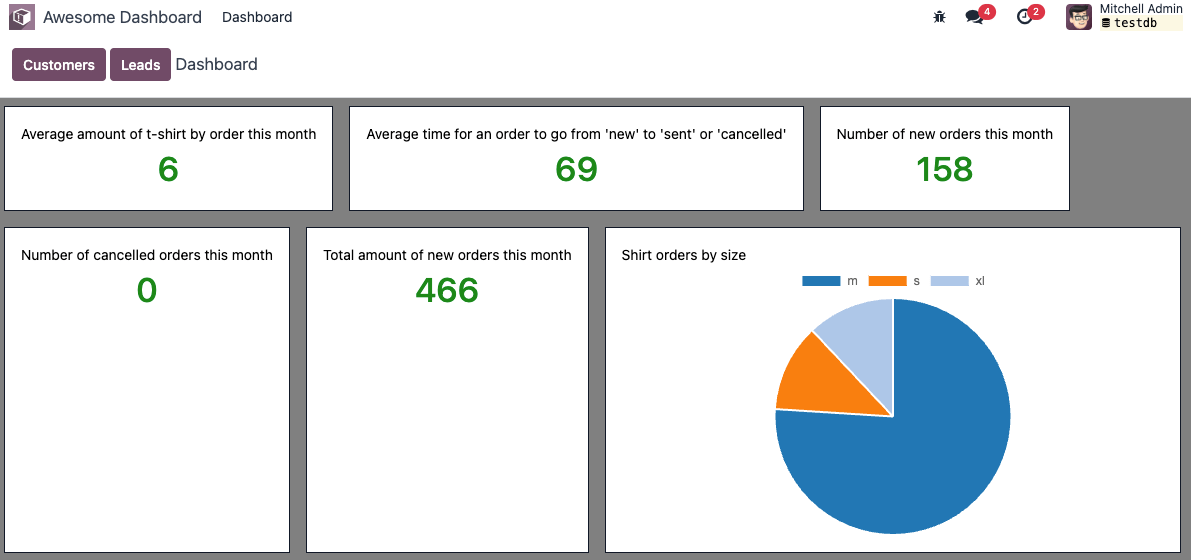
6. Hiển thị biểu đồ hình tròn
Mọi người đều thích biểu đồ (!), vì vậy chúng ta hãy thêm biểu đồ hình tròn vào trang tổng quan của mình. Nó sẽ hiển thị tỷ lệ áo phông được bán theo từng size: S/M/L/XL/XXL.
Đối với bài tập này, chúng ta sẽ sử dụng Chart.js. Đây là thư viện biểu đồ được sử dụng bởi chế độ xem biểu đồ. Tuy nhiên, nó không được tải theo mặc định, vì vậy chúng ta sẽ cần thêm nó vào gói nội dung của mình hoặc tải từng phần. Tải từng phần thường tốt hơn vì người dùng của chúng tôi sẽ không phải tải mã biểu đồ mỗi lần nếu họ không cần.
Create a
PieChartcomponent.Trong phương thức
onWillStartcủa nó, tải biểu đồ, bạn có thể sử dụngloadJs <https://github.com/odoo/odoo/blob/1f4e583ba20a01f4c44b0a4ada42c4d3bb074273/ addons/web/static/src/core/assets.js#L23>_ hàm để tải/web/static/lib/Chart/Chart.js.Use the
PieChartcomponent in aDashboardItemto display a pie chart that shows the quantity for each sold t-shirts in each size (that information is available in the/statisticsroute). Note that you can use thesizeproperty to make it look larger.Thành phần
PieChartsẽ cần hiển thị canvas và vẽ lên canvas bằng cách sử dụngchart.js.Lam cho no hoạt động!
7. Cập nhật đời thực
Since we moved the data loading in a cache, it never updates. But let us say that we are looking at fast moving data, so we want to periodically (for example, every 10min) reload fresh data.
This is quite simple to implement, with a setTimeout or setInterval in the statistics service.
However, here is the tricky part: if the dashboard is currently being displayed, it should be
updated immediately.
Để làm điều đó, người ta có thể sử dụng một đối tượng reactive: nó giống như proxy được trả về bởi useState, nhưng không được liên kết với bất kỳ thành phần nào. Sau đó, một thành phần có thể thực hiện useState trên đó để đăng ký các thay đổi của nó.
Update the statistics service to reload data every 10 minutes (to test it, use 10s instead!)
Hãy sửa đổi nó để trả về một đối tượng reactive. Tải lại dữ liệu sẽ cập nhật đối tượng phản ứng tại chỗ.
Thành phần
Dashboardbây giờ có thể sử dụng nó vớiuseState
8. Lười tải bảng điều khiển
Hãy tưởng tượng rằng trang tổng quan của chúng tôi ngày càng lớn và chỉ được một số người dùng quan tâm. Trong trường hợp đó, việc lười tải trang tổng quan của chúng tôi và tất cả nội dung liên quan có thể hợp lý, vì vậy chúng tôi chỉ trả chi phí tải mã khi chúng tôi thực sự muốn xem nó.
One way to do this is to use LazyComponent (from @web/core/assets) as an intermediate
that will load an asset bundle before displaying our component.
Example
example_action.js:
export class ExampleComponentLoader extends Component {
    static components = { LazyComponent };
    static template = xml`
        <LazyComponent bundle="'example_module.example_assets'" Component="'ExampleComponent'" />
    `;
}

registry.category("actions").add("example_module.example_action", ExampleComponentLoader);
Move all dashboard assets into a sub folder
/dashboardto make it easier to add to a bundle.Create a
awesome_dashboard.dashboardassets bundle containing all content of the/dashboardfolder.Modify
dashboard.jsto register itself to thelazy_componentsregistry instead ofactions.In
src/dashboard_action.js, create an intermediate component that usesLazyComponentand register it to theactionsregistry.
9. Tạo bảng điều khiển chung chung
So far, we have a nice working dashboard. But it is currently hardcoded in the dashboard template. What if we want to customize our dashboard? Maybe some users have different needs and want to see other data.
So, the next step is to make our dashboard generic: instead of hard-coding its content in the template, it can just iterate over a list of dashboard items. But then, many questions come up: how to represent a dashboard item, how to register it, what data should it receive, and so on. There are many different ways to design such a system, with different trade-offs.
For this tutorial, we will say that a dashboard item is an object with the following structure:
const item = {
   id: "average_quantity",
   description: "Average amount of t-shirt",
   Component: StandardItem,
   // size and props are optionals
   size: 3,
   props: (data) => ({
      title: "Average amount of t-shirt by order this month",
      value: data.average_quantity
   }),
};
The description value will be useful in a later exercise to show the name of items that the
user can add to their dashboard. The size number is optional, and simply describes
the size of the dashboard item that will be displayed. Finally, the props function is optional.
If not given, we will simply give the statistics object as data. But if it is defined, it will
be used to compute specific props for the component.
Mục tiêu là thay thế nội dung của trang tổng quan bằng đoạn mã sau:
<t t-foreach="items" t-as="item" t-key="item.id">
   <DashboardItem size="item.size || 1">
      <t t-set="itemProp" t-value="item.props ? item.props(statistics) : {'data': statistics}"/>
      <t t-component="item.Component" t-props="itemProp" />
   </DashboardItem>
</t>
Note that the above example features two advanced features of Owl: dynamic components and dynamic props.
We currently have two kinds of item components: number cards with a title and a number, and pie cards with some label and a pie chart.
Create and implement two components:
NumberCardandPieChartCard, with the corresponding props.Create a file
dashboard_items.jsin which you define and export a list of items, usingNumberCardandPieChartCardto recreate our current dashboard.Import that list of items in our
Dashboardcomponent, add it to the component, and update the template to use at-foreachlike shown above.setup() { this.items = items; }
Và bây giờ, mẫu bảng điều khiển của chúng tôi là chung chung!
10. Làm cho bảng điều khiển của chúng tôi có thể mở rộng được
Tuy nhiên, nội dung danh sách vật phẩm của chúng tôi vẫn được mã hóa cứng. Hãy để chúng tôi khắc phục điều đó bằng cách sử dụng sổ đăng ký:
Thay vì xuất danh sách, hãy đăng ký tất cả các mục trên trang tổng quan trong sổ đăng ký
awesome_dashboardNhập tất cả các mục của sổ đăng ký
awesome_dashboardtrong thành phầnDashboard
The dashboard is now easily extensible. Any other Odoo addon that wants to register a new item to the dashboard can just add it to the registry.
11. Thêm và xóa các mục trên bảng điều khiển
Let us see how we can make our dashboard customizable. To make it simple, we will save the user dashboard configuration in the local storage so that it is persistent, but we don't have to deal with the server for now.
Cấu hình trang tổng quan sẽ được lưu dưới dạng danh sách id mục đã xóa.
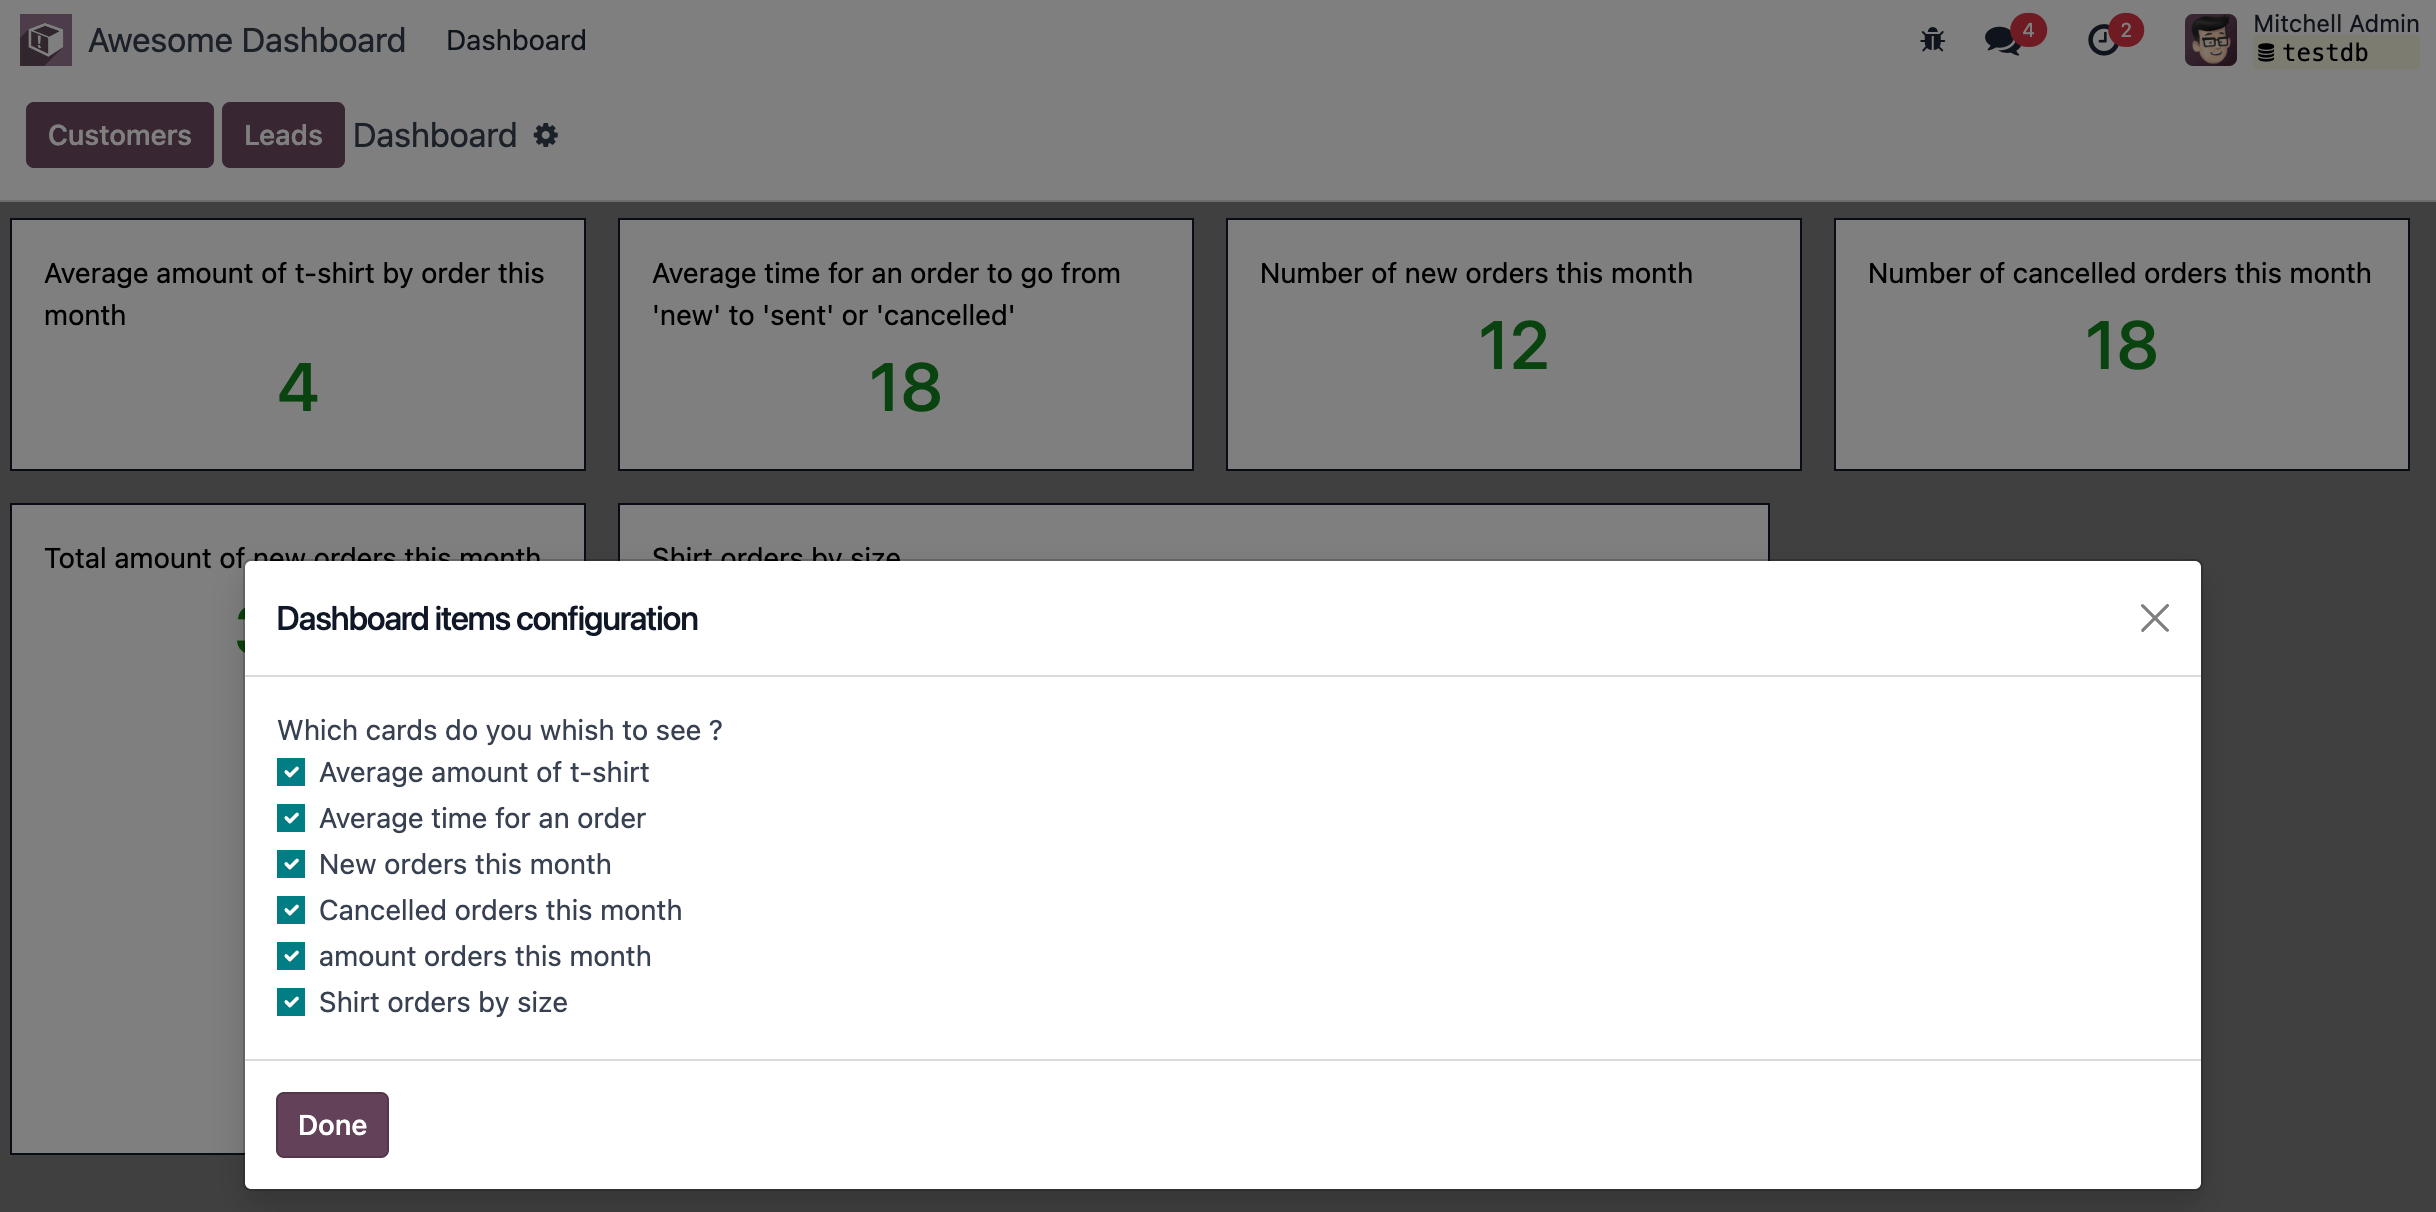
Add a button in the control panel with a gear icon to indicate that it is a settings button.
Clicking on that button should open a dialog.
In that dialog, we want to see a list of all existing dashboard items, each with a checkbox.
There should be a
Applybutton in the footer. Clicking on it will build a list of all item ids that are unchecked.We want to store that value in the local storage.
And modify the
Dashboardcomponent to filter the current items by removing the ids of items from the configuration.
12. Tiến xa hơn
Dưới đây là danh sách một số cải tiến nhỏ mà bạn có thể thử thực hiện nếu có thời gian:
Đảm bảo ứng dụng của bạn có thể translat (với
env._t).Clicking on a section of the pie chart should open a list view of all orders that have the corresponding size.
Save the content of the dashboard in a user setting on the server!
Make it responsive: in mobile mode, each card should take 100% of the width.